December 2018 Blog Statistics
This site utilizes Google Analytics, Google AdSense, as well as participates in affiliate partnerships with various companies including Amazon. Please view the privacy policy for more details.
It’s now the end of the year and time for my twelfth monthly blog stats report. Twelve monthly blog stats mean a full year’s worth of blog stats, and, as I promised in the first blog statistic report I have some deeper analysis for the entire year.
First, let’s get through the numbers for the month of December.
I published six blog articles this month:
- Christmas and New Year’s Themed Table Topics
- 2018 End of Year Side Income Report
- What is the Total Number of Gifts in the 12 Days of Christmas?
- How to Solder (Sweat) Copper Pipe
- My Robinhood Stock Picks for November 2018
- November 2018 Book Reading List
- Quick Life Update
Alexa
- Global Rank → 906,349
- Rank in the United States → 270,380
- Total Sites Linking In → 137
Google Analytics
- Sessions → 1,432
- Users → 1,268
- Pageviews → 2,076
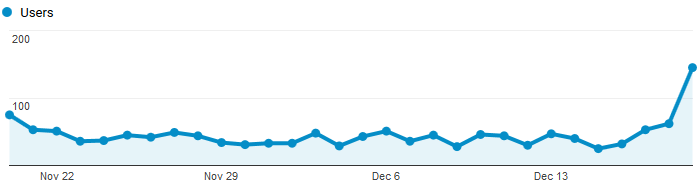 Google Analytics Graph for December
Google Search Console
- Clicks → 613
- Search Impressions → 29,500
- Average position → 21.9
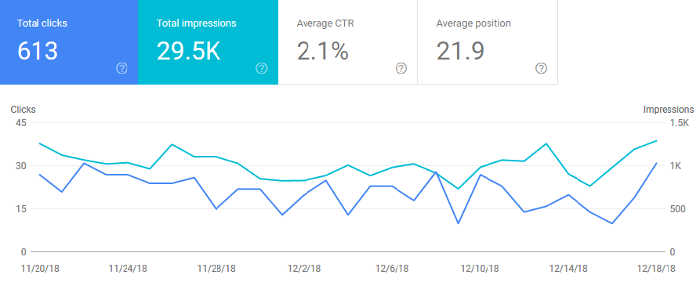 Google Search Console Graph for December
AdSense
- Balance → $32.81
- Estimated earnings → $0.99
- Impressions → 1,255
- Clicks → 0
Ratios
- Earnings / 1,000 sessions = $0.99 / 1.432 = $0.69
- Earnings / 1,000 pageviews = $0.99 / 2.076 = $0.48
- Earnings / 1,000 impressions = $0.99 / 1.255 = $0.79
- Earnings / day = $0.99 / 30 = $0.03
- Sessions / day = 1,432 / 30 = 47.7
- Pageviews / day = 2,076 / 30= 69.2
- Impressions / day = 1,255 / 30 = 41.8
Yearly Analysis
I only have “total” statistics for Google Analytics and Adsense.
It wouldn’t make sense to have a “total” for Alexa, since that is more of an instantaneous statistic (sort of like how you can’t ask what is the total mph you drove during a trip). There is an average, but I don’t think that makes much sense either (although the non-weighted average of my global rank is 1,087,929 if you are curious).
As for the Google Search Console stats, I only started correctly using it since August and first reported the numbers in my September report. Maybe next year I’ll have more numbers and I’ll be able to report.
Ok, so let’s quickly go through the raw numbers for the year. Remember, this is for the timeframe of from December 20, 2017, through December 19, 2018.
Google Analytics
- Sessions → 21,073
- Users → 16,982
- Pageviews → 27,747
AdSense
- Balance → $32.81
- Estimated earnings → $18.06
- Impressions → 19,244
- Clicks → 19
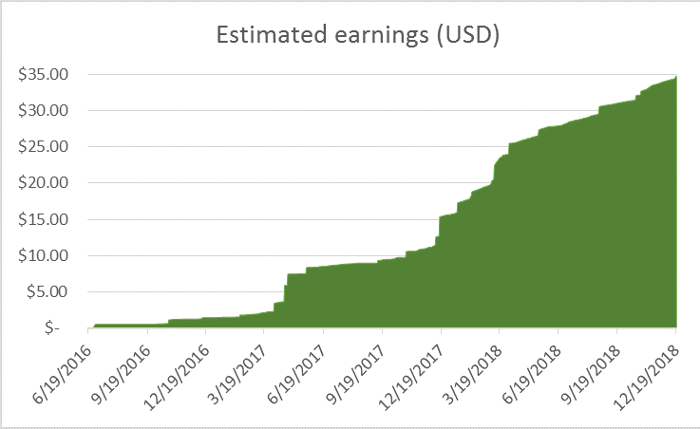 Google AdSense Cumulative Graph
The above graph is my cumulative earnings on AdSense since the day before I earned my first penny - which was on June 20, 2016. My AdSense reports that Google gives me goes back to March 30, 2016 (maybe that’s when I added it to this website?), but I earned nothing between that date and March 30, 2016.
I find it interesting that I earned pretty much nothing in that first year. There’s a small jump slightly after March 2017, but then it plateaus until the end of 2017. After that, my earnings seem to grow rather consistently.
I made a similar graph for my July 2018 report.
Ratios
- Earnings / 1,000 sessions = $18.06 / 21.073 = $0.86
- Earnings / 1,000 pageviews = $18.06 / 27.747 = $0.65
- Earnings / 1,000 impressions = $18.06 / 19.244 = $0.94
- Earnings / day = $18.06 / 365 = $0.05
- Sessions / day = 21,073 / 365 = 57.7
- Pageviews / day = 27,747 / 365= 76.0
- Impressions / day = 19,244 / 365 = 52.7
Correlations
Here’s where I think things will get interesting - how do different stats correlate with one another?
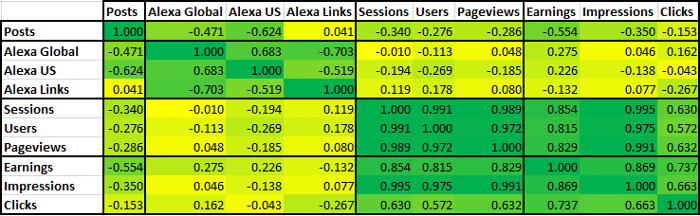 Blog Statistic Correlations
I created the above table in Excel. The horizontal categories are identical - and in the same order - as the verticle ones. This allows for a few sanity checks to see if I got the calculations correct (even though I just used Excel’s correlation function CORREL). First, the diagonal axis should consist of only ones - that is, something is 100% correlated to itself. Second, the table should mirror itself along the diagonal axis. This is because the correlation of A to B is the same as the correlation of B to A.
I also put bold lines around similar properties, forming four groups: posts (which only has itself), Alexa, Google Analytics, and AdSense. Finally, I used Excel’s conditional formatting to give a yellow color if the number is close to zero, and dark green if the number is close to one or negative one. The colors for numbers between 0 and 1 (or 0 and -1) are interpolated between yellow and dark green.
The first interesting thing I noticed is that the numbers are highly correlated with other numbers in the same property. This makes sense; if you have more unique users (or visitors) to your website, you’d naturally expect to have more sessions and page views. Similarly, you’d expect that the more ads served (impressions) or the more ads clicked, the higher the revenue.
However, it seems that the Alexa properties are not highly correlated with either of the Google properties. You’d expect that the more visitors to your site, the lower your Alexa rating. There are two reasons I think that the correlation is low between these properties. The first is that Alexa is an Amazon product, whereas Analytics and AdSense are Google products, meaning that the data source is not the same. The second is that Alexa is a ranking system, so the score is not just dependant on how many people visit your site, but also how many people visit every other website. So if the website traffic doubles for every website, the Alexa ranking would theoretically not change.
What I find most interesting the correlation between the number of posts per month and the other properties. However, there’s a negative correlation between the number of posts per month and earnings, as well as the number of posts and sessions. I think this anomaly is mostly due to the fact that the number of posts a month do not vary much - I posted anywhere from 3 to 7 posts a month.
That’s All, Folks
That’s it for 2018. I hope everyone has a wonderful holiday, be it Christmas or whatever you celebrate, and a wonderful New Year. I still may make some posts this year, but will report on that in January 2019’s blog statistic report.
Leave a Reply