Meeting My Fitness Goal in 2020
This site utilizes Google Analytics, Google AdSense, as well as participates in affiliate partnerships with various companies including Amazon. Please view the privacy policy for more details.
Part of my 2020 goal to improve my health was to weigh less than 225 pounds.
The bad news is I probably won’t weigh less than 225 pounds by the end of the year. The good news is that I’m awfully close.
I started the year at 245 pounds. Come July 4th, I was at 251.2 pounds. This morning, on December the 28th, I weighed 228.6 pounds.
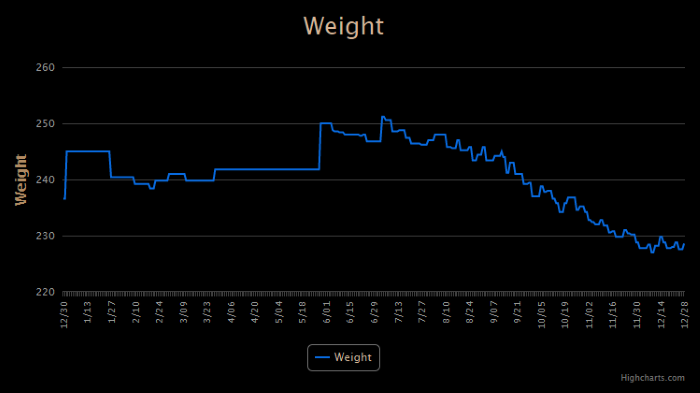 Chart of my weight in pounds over the past year.
What was the source of my change halfway through the year? In addition to tracking my food on MyFitnessPal, I began running. Initially, I was only running three days a week - Monday, Wednesday, and Friday - but at some point, I upped that to five days a week. Every day except for the weekend.
On the weekends, my wife and I try to go on a hike with our two little ones. And, during the week, in addition to my run, my wife and I walk our dogs around the block at lunchtime.
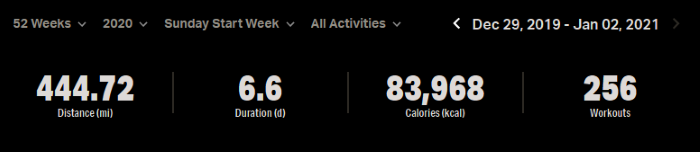
Overall, according to the stats on MapMyFitness, I’ve exercised (walked, ran, & hiked) a total of 444.72 miles over 6.6 days (that’s 158 hours and 24 minutes - assuming no rounding!) and burned 83,968 Calories (that is, kilocalories, or just 83.968 plain ol’ lowercase-c calories) over a total of 256 workouts.
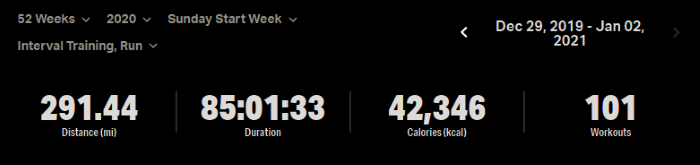
If we just look at the stats for my runs, then I ran 291.44 miles over 85 hours, 1 minute, and 33 seconds, burning 42,346 Calories over 101 runs.
So I’m not upset that I won’t weigh less than my goal of 225 pounds by the end of the year. I’m sure I can get those last few pounds off in the next year.
My thought is, now that I seem to be at an acceptable weight - what should my next health goals be? Better runs? What else can I measure?
Additional Charts
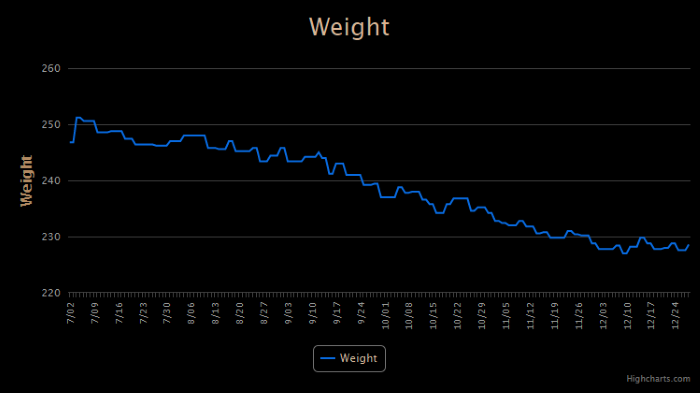 Chart of my weight in pounds over the past 180 days.
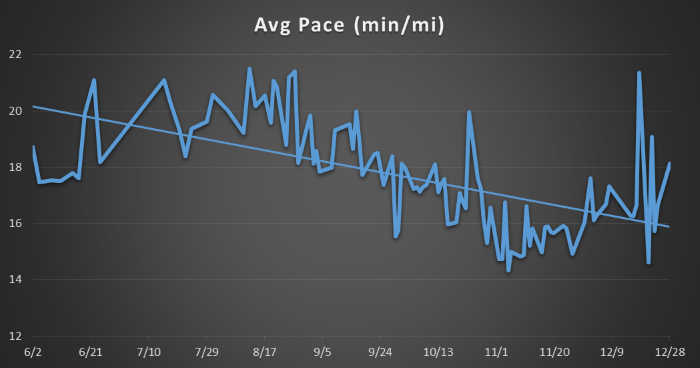 Average Pace in minutes per mile. The trendline shows a decrease in pace, which means an increase in speed (which is good).
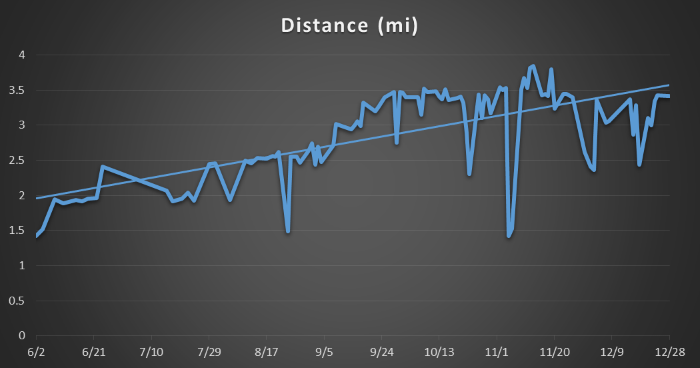 Distance ran per run, in miles. How far I ran on each run. The trendline shows I’m going farther than when I started. The dips are those runs where I had errands to run and so didn’t have enough time to run as much.
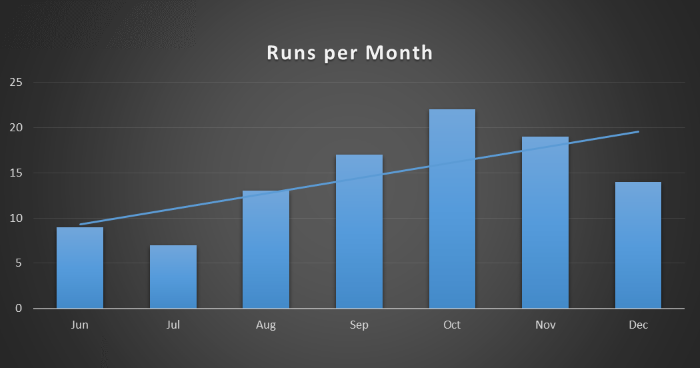 Number of runs per month. The trendline shows I’m running more each month than when I started. December isn’t over, so I should have more runs this month.
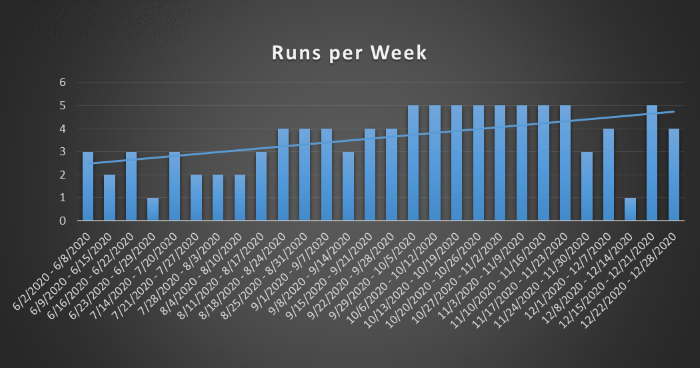 Number of runs per week. Again, the trendline shows I’m running more than when I started.
Leave a Reply